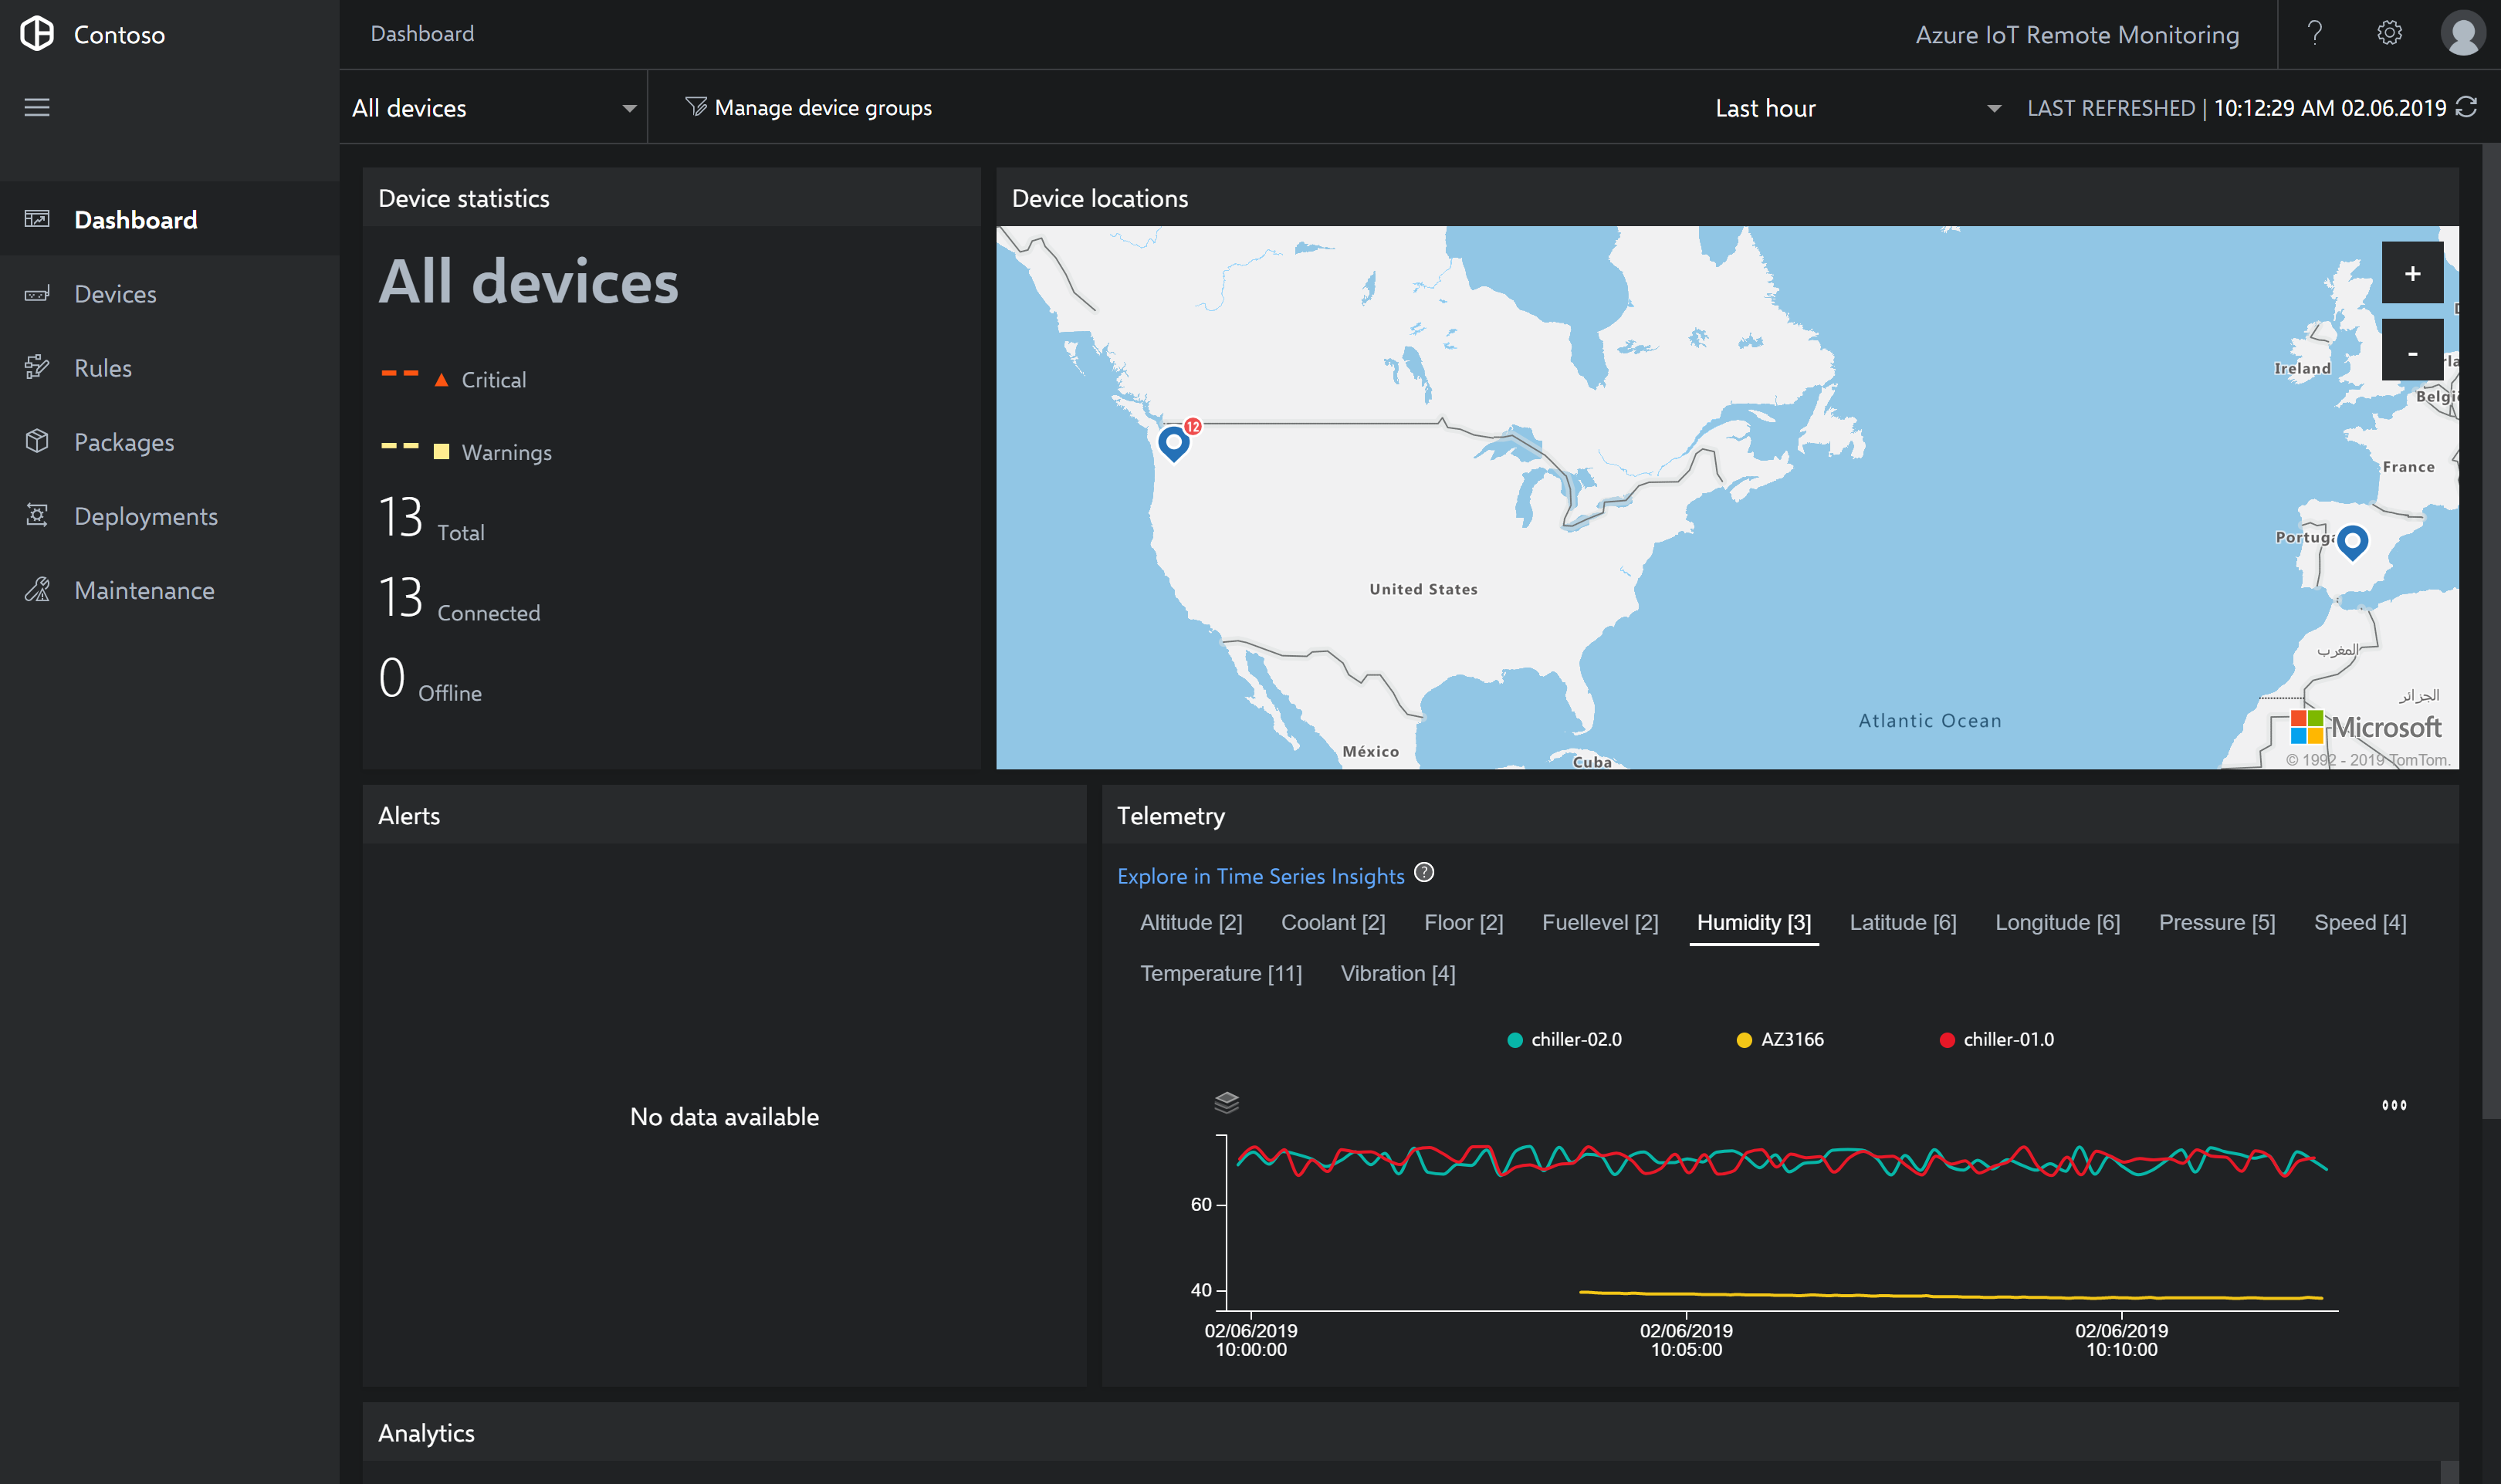
We will now test the project to ensure that data is being sent from the MXChip to Azure IoT services.
The device will now send data over Wi-Fi to your Azure IoT Suite. To see the results, follow these steps:
-
Go to your Azure IoT Solution Accelerator website and click Dashboard. If you have closed the tab, go to the Solution Accelerator website here and re-launch the created accelerator.
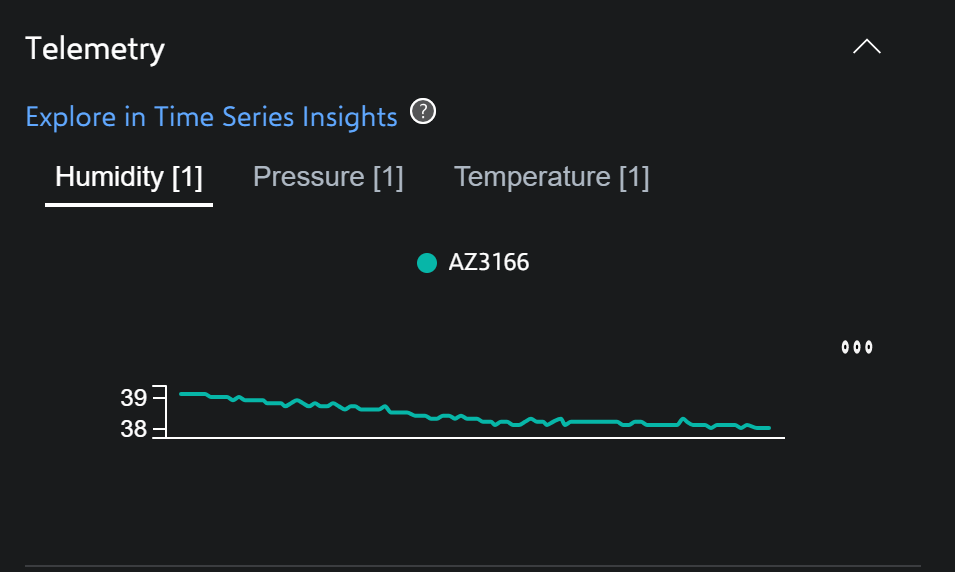
On the page, you should be able to see the status of your MXChip sensors. For example on the telemtry area, click Humidity and you should see the AZ3166 device listed with real data.

On the Devices page on the left, if you click on the sensor name (AZ3166), a tab opens on the right side of the dashboard where you can see the MXChip sensors chart in real time.

Now we have confirmed the MXChip is sending data to Azure, we can start to properly visualise the data in Power BI.
The next tutorial walks you through creating two Power BI dashboards; one a realtime chart from a live streaming dataset and the other from data sent to a SQL database.
Building dashboards in Power BI means that you can also make each panel interact with one another as you select specific pieces. For example, you could have a filter that shows you only information about your simulated trucks and each piece of your dashboard would interact to show you only simulated truck information. If you would like to use a tool other than Power BI, you can also extend these steps to use your visualization tool of choice and hook into the Cosmos Database, or custom database if you’ve set one up.